
 Articles
Measure the ROI of a loyalty programme
A programme can show strong sales without creating additional value. Switch from revenue to incremental margin, integrate all costs, and test the sensitivity of your model.
 Measure to move forward more effectively.
 Measure to move forward more effectively.

Key takeaways
- Measure the additional margin rather than total member revenue.
- Integrate launch, operation, rewards, and logistics.
- Present a conservative scenario and the limitations of attribution.
Define what means profitable
Return on investment compares net income to costs incurred. In a loyalty programme, the main challenge is determining what would have happened without the programme. The most active members may already be the best customers. Comparing their revenue to that of non-members therefore does not demonstrate an effect of the programme. Address the question of incrementality from the outset. Retention, acquisition, and data quality objectives may require additional indicators.
Building a credible benchmark
A prior period is a good starting point, but seasonality, pricing, and product range changes can shift results. A comparable comparison group, when feasible, helps estimate the additional effect. The rules for constructing this group should be explicit. A randomized experiment is not always possible; cohorts or an adjusted before-and-after analysis then have their own limitations. Document these limitations in the reporting rather than turning an observed change into proven causality.
Moving from Revenue to Margin
A sales increase can mask a margin reduction or a shift in purchases. Use a contribution margin appropriate to the products and costs that the programme actually changes. Avoid considering all member revenue as a gain. Cannibalization of another offer, cancellations, and returns must be taken into account. Finance and marketing must share the same conventions. A simple model with visible assumptions is more useful than a sophisticated calculation that cannot be reconciled.
Include the costs that run the system
Rewards consumed do not represent the full cost. Add the framework, platform, integrations, campaigns, support, logistics, and management. Distinguish between launch, operation, and variable costs. Points issued, consumed, and still available are three different concepts. Their accounting treatment must be validated with finance. A low cost linked to disappointing consumption may indicate a programme that lacks engagement, rather than good performance. Budgetary balance should not obscure the user experience.
Work with scenarios
The website simulator displays activation, basket size, frequency, margin, generosity, consumption, and fixed costs. Modify one assumption at a time to understand its sensitivity. Then compare a conservative, central, and ambitious scenario. The calculated amounts remain conditional results based on the entered assumptions. A change in consumption influences the cost without demonstrating a change in sales. The model should be used to prepare a decision and then compared with observed data after launch.
Fictitious Example: From Gain to ROI
| Element | Assum | Calculation |
|---|---|---|
| Estimated Additional Revenue | 150 000 € | After Comparison and Adjustments |
| Contributory margin | 30 % | 45 000 € |
| Total cost | 30 000 € | Platform, engagement, rewards, and support |
| Net profit | 15 000 € | 45 000 − 30 000 |
| ROI | 50 % | 15 000 / 30 000 |
| Break-even point | €100 000 in additional revenue | 30 000 / 30 % |
Vary the assumptions underlying the result
Let's return to the previous hypothetical example with a total cost of €30,000 and a contribution margin rate of 30%. At €100,000 of additional revenue, the margin just covers the cost and the ROI is 0%. At €120,000, the margin reaches €36,000 and the ROI 20%. At €150,000, the ROI reaches 50%. These scenarios assume a constant cost and margin rate.
If rewards and treatment vary with activity, recalculate these costs in each scenario. Sensitivity must reflect the programme's economics; it's not simply a matter of changing revenue while leaving all other lines fixed.
What the decision-making process should verify
- The attributed effect: comparison method, populations, period, and limitations of the estimation.
- The economics: the margin assumption, fixed and variable costs, rewards, engagement, support and integration.
- The time frame: the time it takes for gains and costs incurred to appear before the first result.
- The decision: central hypothesis, conservative scenario, break-even point, and next review deadline.
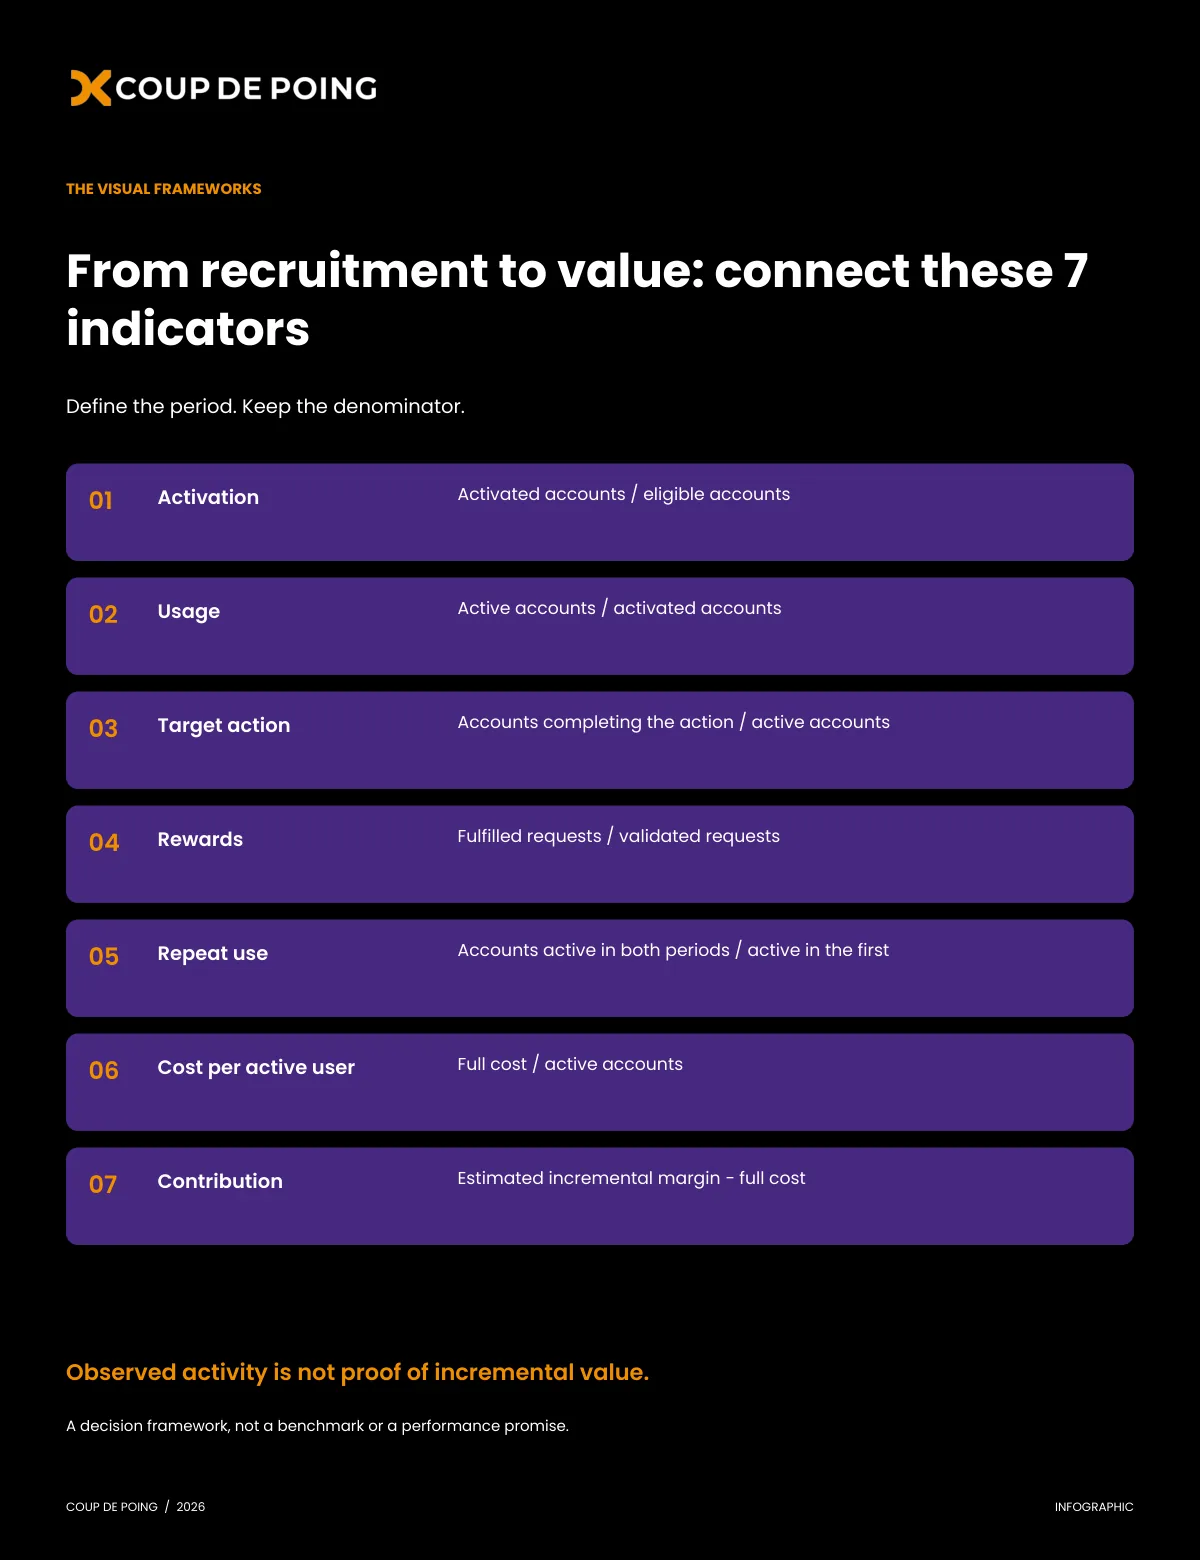
 Infographics
 Glossary