Infographics
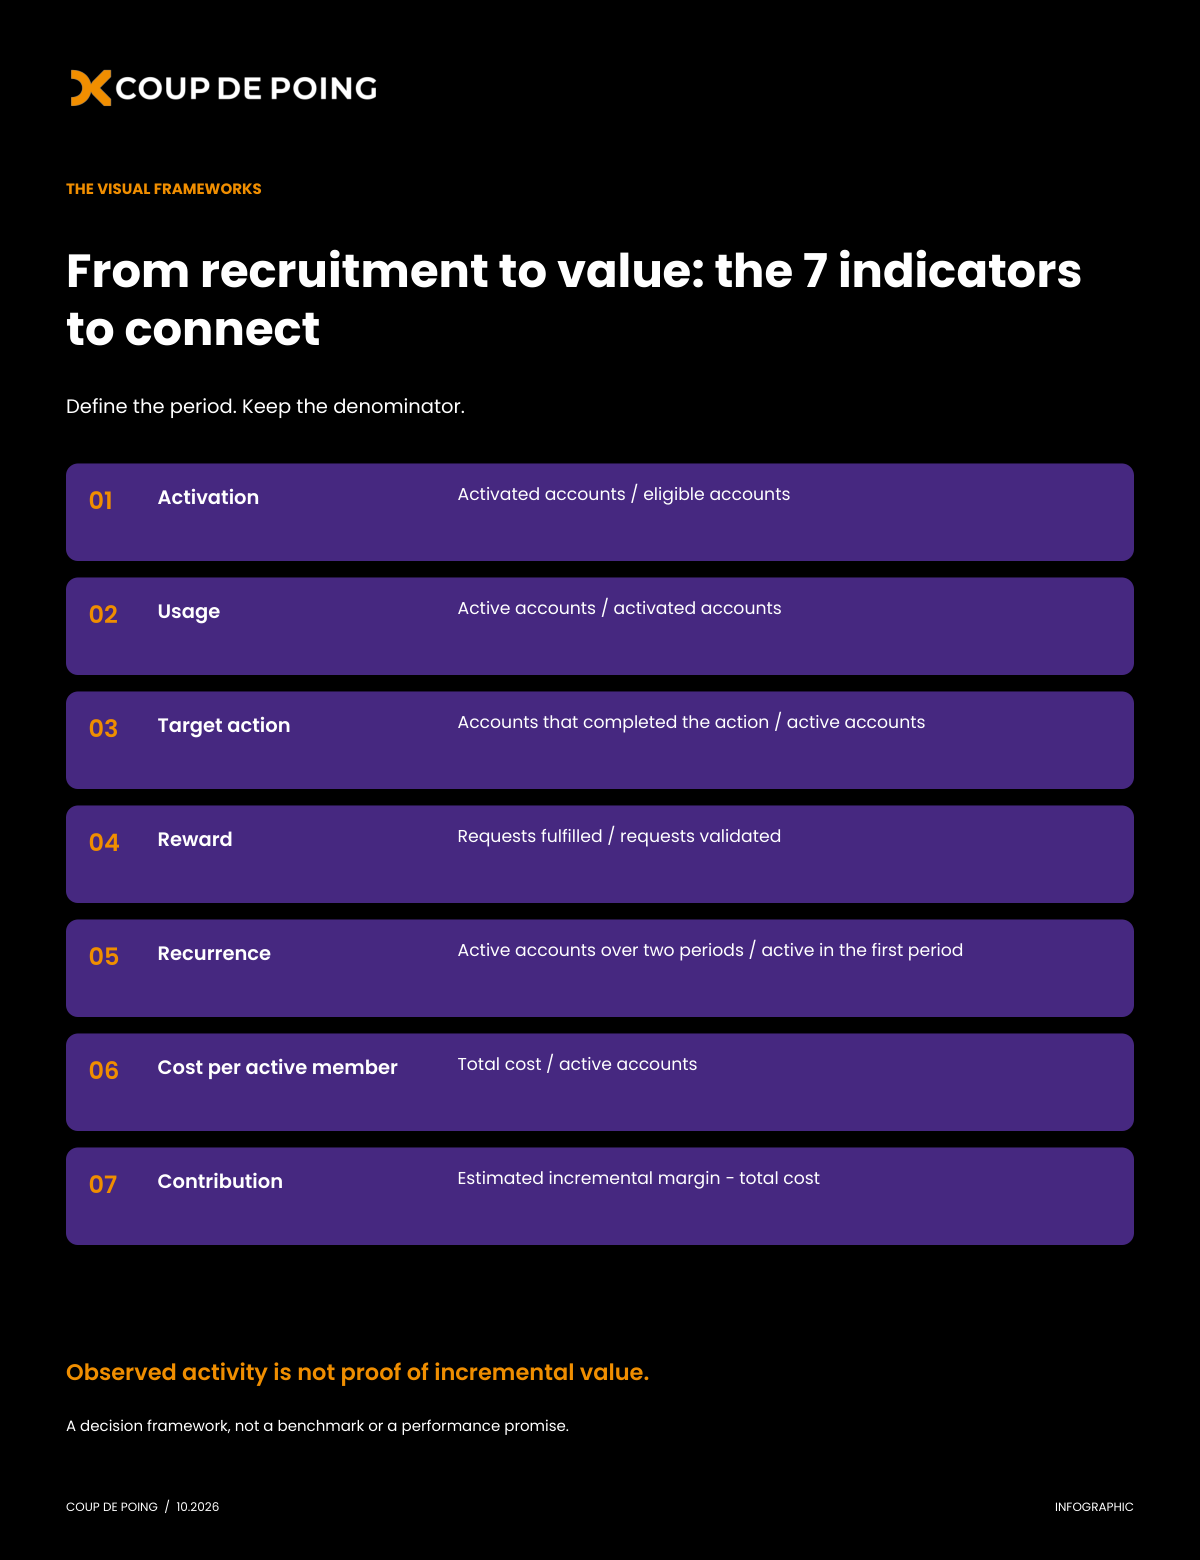
From recruitment to value: the 7 indicators to connect
A visual grid to link access, usage, rewards, and contribution. Each indicator specifies what it measures and the denominator to keep.
Get the downloadable document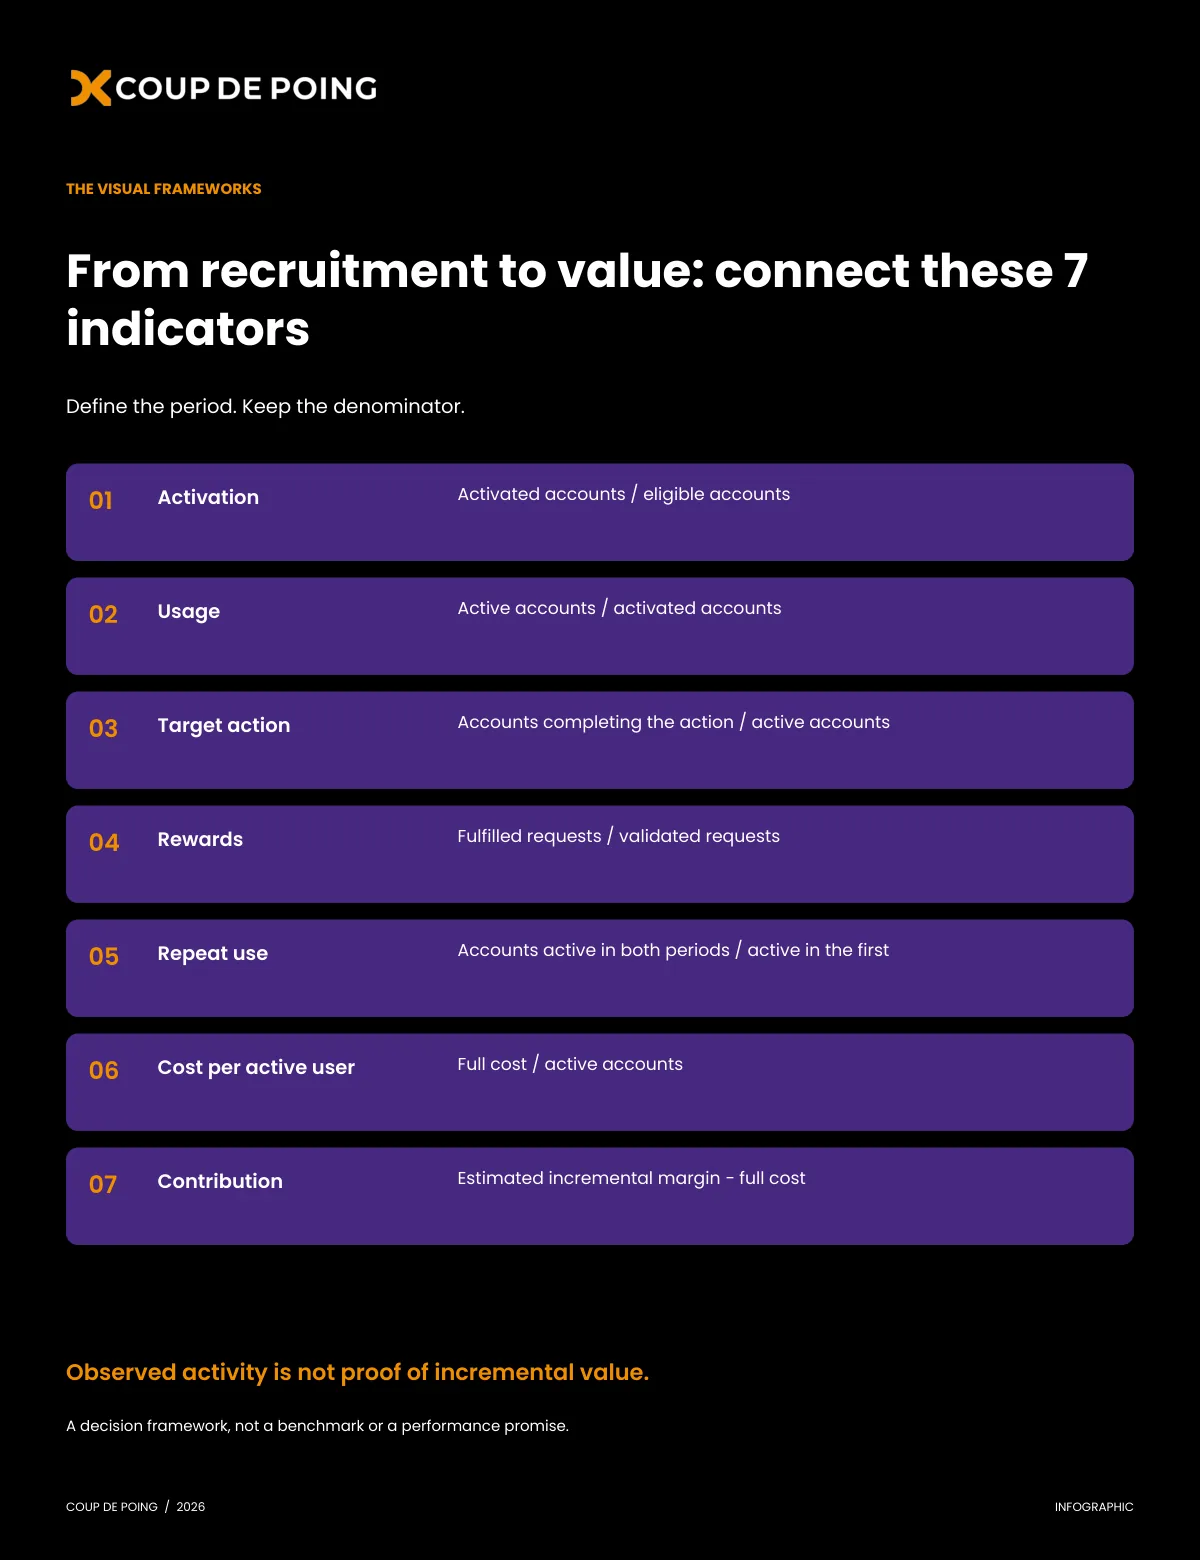
Key takeaways
- Always define the period and the denominator.
- Link the indicators to operational decisions.
- Distinguishing between observed usage and estimated contribution.
Seven indicators, seven interpretations
| Indicator | Calculation or measurement | What it reveals |
|---|---|---|
| Activation | Activated accounts / eligible accounts | Ability to enter the programme |
| Usage | Active accounts / activated accounts | Actuality of engagement over the period |
| Target action | Accounts that completed the action / active accounts | Alignment with the programme objective |
| Reward | Requests fulfilled / requests validated | Promise actually kept |
| Recurrence | Active accounts over two periods / active in the first period | Continuity of usage |
| Cost per active member | Total cost / active accounts | Economic effort of the device |
| Contribution | Estimated incremental margin − total cost | Estimated economic value |
Set a period and a population
Before calculating a rate, define what an activated account, an active participant, and a target action are. Use the same period for the numerators and denominators, except when the metric explicitly tracks two cohorts or two periods. Do not mix people, accounts, and transactions. This grid uses the account as the unit for tracking users.
Don't confuse path and causality
The initial measurements describe how the programme works. The contribution requires a credible comparison to estimate what would not have happened without the system. The grid is not a benchmark: it does not contain any universal quantified objectives.
An example of a decision:
High activation followed by low usage suggests reviewing the initial experience and the usefulness of the offering. High usage accompanied by unfulfilled requests calls for action on validation or logistics. The right dashboard indicates where to act, not just what is increasing.
Move from the dashboard to the decision
Link each indicator to a question and a possible action. Activation helps examine entry into the customer journey; repeated participation provides information on usage; consumption sheds light on the accessibility of benefits. The economic contribution then requires a comparison and defined costs. Always present volumes with rates to maintain a measure of the observed population.
Define your measurement framework
| Field | To be documented | Control |
|---|---|---|
| Target audience | People, accounts, orders, or points. | Same unit in the numerator and denominator. |
| Time period | Dates, time since entry and maturation period. | Compare cohorts at the same time since entry. |
| Event | Validated action and deduplication rules | A technical retry must not count as a new participation. |
| Source | Reference system and update frequency. | Visible rejections and missing data. |
| Decision | Responsible party and action in case of changes. | A statistical variation is not automatically an effect of the programme. |
The key ideas in one visual
Download it, share it with your team and use it in your next workshop.

 Measure to move forward more effectively.

 Articles
 Glossary